
Gamma Scalping Realized Volatility Pro
Gain insight into 0DTE option prices using
Gamma Scalping Realized Volatility
by Tick Analytics.
The Full Suite of Tools Give Maximum Insight into 0DTE Options
Fast Intraday Realized Vols, 15min on SPX, 120min on Bitcoin;
Market Micro-structure with Various Limit-order Execution Rates;
Live Vol Cone showing "Spot" Value of Realized Vol across Various Intraday Time-frames
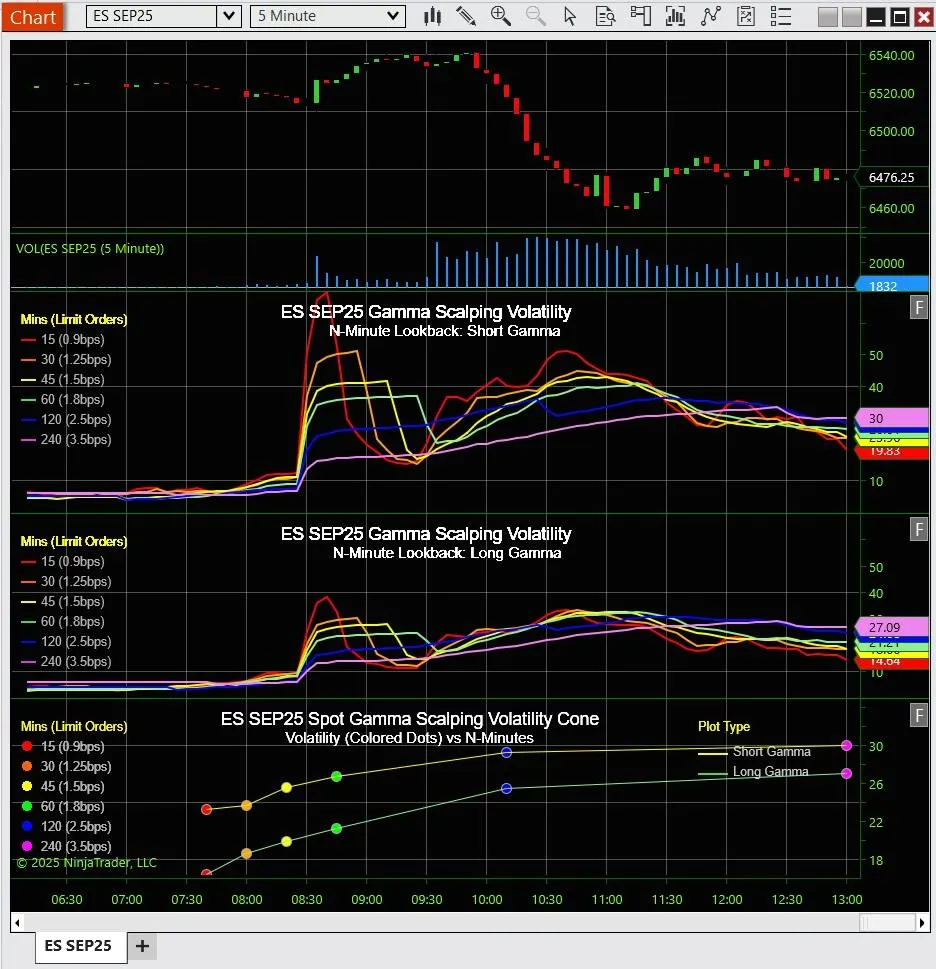
Live Chart in NinjaTrader showing E-minis (S&P500 futures) prices, volume, short gamma scalping realized Vol,
long gamma scalping realized Vol and the Vol cone for various trailing minute averages
Short-End of the Vol Cone
We use Gamma Scalping Realized Volatility (rVol), see below, to value short-dated rVol for various trailing windows, measured in number of minutes. The long gamma and short gamma last values are entered into the Vol cone graph for various trailing windows. The size of the re-hedge steps used (again, see below for an explanation of how Gamma Scalping rVol works) is chosen to make sure we have about 80 re-hedge executions during the window, to ensure a low variance result (for a static distribution).
This process is similar to the usual vol cone, with various trailing windows for vol calculations, but instead of only considering daily returns, we consider various rehedge-step sizes to ensure the average contains about 80 executions. This would be analogous to considering various return durations, say daily returns for a 50 day moving rVol estimator using the usual 1-standard-deviation formula, and 2 day returns for a 100 day moving rVol, with the objective of obtaining similar accuracy.
Gamma Scalping Realized Volatility
The idea is to have a measure of intra-day realized volatility (rVol) that is not critically dependent on assumptions about the security price change process, such as normal returns (lognormal price changes) and even allows for jumps.
Method:
1. The above graphs are essentially P&L generation rates for different gamma scalping strategies; let's say different traders.
2. P&L generation rates are not model or even distribution dependent: it's a robust powerful concept for examining market dynamics and micro-structure.
3. The long case (third graph) is selling at the bid, when underlying price moves up, and buying at the ask, when underlying price moves down, with limit orders, entered at various constant (bps, 0.01% of price) step separations and indicated in the graph legend with different colors for each step-size/strategy; when a trade gets executed the last-executed limit-order is then re-entered. This maintains a ladder of limit orders. This is the (dynamic-replication) delta-hedging strategy typically executed for a long (constant) Gamma position. Repeatedly selling high and buying low generates a profit when the stock stays within a range. This profit counters the time decay on the option position.
4. The short case (second graph) is selling at the bid, when underlying price moves down, and buying at the ask, when underlying prices moves up, as soon as the price hits the ladder rung levels. This is not quite, but is very similar to, market stop-loss orders (which execute market orders when a trade is registered at the rung level) which are often used to dynamically hedge short Gamma positions. Repeatedly buying high and selling low generates a loss when the stock stays within a range. This loss is countered by the (negative) time decay, i.e., profit on the short gamma option position.
5. Each color line is a different strategy or “trader”. For each strategy, for example, the fastest trader represented by the red line, we count the number of times the re-hedge trade occurs over a trailing period of N minutes, as indicated in the legend, and hence calculate an average rate of re-hedges, i.e., rate of P&L generation. Note that the slowest trader, the purple line, has the widest re-hedge ladder steps and requires the longest averaging period (N minutes) to ensure requisite accuracy/stability.
6. The last step of the analysis is to translate these P&L generation rates into any model variance input, via a decay term. For the lognormal case of the Black-Scholes option model, this translation is
P&L rate = 1/2 * rVol^2 * S^2 * Gamma = 1/2 * (% S)^2 * Gamma * (rate of re-hedges)
i.e., rVol = % / sqrt (average re-hedge time)
The formula rVol = % / sqrt (expected re-hedge time) is derived in these papers[1,2,3]. These rVols are used for the y-axis (instead of P&L generation rate). We are expressing P&L generation rate in the same "basis" as iVol making them directly comparable.
7. Note finally, any model can be used, thus any security can be analyzed, such as interest rates and spreads, which are commonly understood to be not well modeled by lognormal price change distributions, simply by using a different translation from P&L rate to model input parameter(s).
Interpretation:
1. Generally speaking, for a perfectly stable lognormal-distribution (without jumps), the long side shows the rainbow with spaced flat lines from red (fastest trader with tightest re-hedge steps) upwards to purple (slowest trader with largest re-hedge steps). The short side shows higher vols and the opposite; flat lines with from red down to purple. The limit for large re-hedge steps (compared to bid/ask spread size) is that the purple lines will show the same values for long and short. The observed "slippage", i.e., differences from the limiting purple case, is due to "paying" the bid/ask spread. See a “pure” 20 vol case below, i.e., using theoretically generated stochastic bid/ask markets to illustrate the pure lognormal returns case.
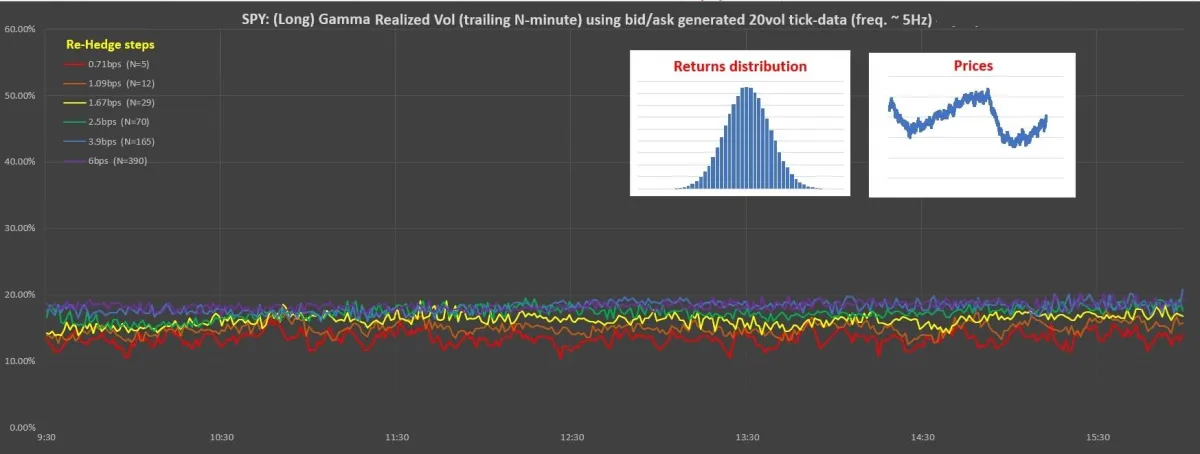
Long Gamma Scalping Realized Vol on a theoretical 20vol equity with 0.4bps bid/ask spread
2. The second effect is that when jumps occur, or even just sudden increases in rVol, the red line (fast trader P&L) jumps above the (slow trader P&L) purple line, due only to the red line being a shorter averaging time and therefore quicker response.
3. The third effect is that the different strategies do sometimes fundamentally generate different P&L (rVols), even when static, due to market distribution structure not being lognormal. For example, this can be seen after many vol jumps, the red line jumps above purple but stays there for longer than its averaging period: this shows a leading indicator/signal, that is autocorrelation, of short-term rVol and the red line (fast) trader is making more money in the long case even though there is slippage. This is a powerful paradigm to understand how P&L might be improved when dynamically hedging a book.
Refs:
1. R. Navin, "Measuring Intra-Day Volatility Using First Crossing Time," https://ssrn.com/abstract=4287885
2. E. Sinclair & C. Merrill, "Volatility Estimation via First Exit Times," https://ssrn.com/abstract=3904792
3. T. G. Andersen, D. Dobrev & E. Schaumburg, “Duration-based Volatility Estimation,” https://www.econbiz.de/Record/-/10003854415


Legal
Privacy Policy
Terms & Conditions
© Tick Analytics 2026
All Rights Reserved
Tick Analytics LLC is not a broker-dealer, Futures Commission Merchant, or registered investment adviser; it does not solicit trades or offer investment advice, recommendations, or advocate taking specific trades.
References to third-party platforms, brokers, data providers, or vendors are for informational purposes only. Tick Analytics LLC does not endorse, guarantee, or assume responsibility for any third-party content or services.
Gamma Scalping Realized Volatility Indicator is a software tool for informational purposes only, it does not provide investment advice or trading recommendations.
Risk Disclosure: Trading in options, zero-day-to-expiration options, futures, options on futures, foreign exchange, cryptocurrencies, or other leveraged instruments involves substantial risk and may not be suitable for all investors. You may lose more than your initial investment. Risk capital — money that can be lost without affecting financial security or lifestyle — should be used. Past performance is not necessarily indicative of future results. Hypothetical performance results have inherent limitations; actual results can differ materially.
Testimonials on this site may not be representative of the experience of other traders and are not a guarantee of future performance or success.
Review the CFTC & NFA advisories for additional information on virtual-currency and leveraged-trading risks.
NinjaTrader® is a registered trademark of NinjaTrader Group, LLC. Tick Analytics LLC is not legally affiliated with NinjaTrader or any of their affiliates. Any reference to “NinjaTrader” is for descriptive purposes only and does not imply any relationship with, or approval by, the NinjaTrader companies.